
Tracking returns rates using email receipts
Addressing one of the common blind spots in online retail

Until now, my newsletter has exclusively explored web data. However, this week I decided to discuss a different topic that I touched upon a couple years back in a Medium article: tracking returns rates using email receipt data. I thought it would be a good idea to revisit and expand on that post here, adding some more context about the data and some details on how my solution was implemented.
If you asked me, “If you could only eat one food for the rest of your life only work with one type of data for rest of your life — what would it be?” — I'd probably pick email receipt data—with credit card transaction-level data a close second.
Granular email receipt data has many layers of complexity. There are challenges like varying panel sizes, changing email formats from merchants, and even instances where email providers cut off access entirely. But once we figure out how to deal with all the quirks (which can be really hard work), the data reveals some really granular and unique insights, which might not be available from any other sources.
A common question I get from people from outside the industry is, "Where does email receipt data come from?" While I haven't been active in the data market recently, and my knowledge is somewhat outdated, I'm familiar with several players in this space:
MeasurableAI — a global email receipt data provider, offering particularly strong coverage in the APAC region.
Foxintelligence by NielsenIQ.
Gener8 — this UK startup rewards its users for sharing anonymised email and other online data.
Edison Mail — an email app company, acquired by YipitData in 2021.
(If someone wants to be added or removed from the list - please reach out. I’m not compensated for any of the mentions.)
Typically, these data providers would operate an app that offers rewards or services in exchange for data from a panel of consumers. These consumers knowingly and explicitly agree to share their data in return for tangible benefits. The data is then aggregated or anonymised before being sold, ensuring that no personally identifiable information is passed on to buyers. When it comes to email receipt data, the datasets usually exclude the contents of the emails, focusing instead on parsed data about transactions, bookings, and purchases—all stripped of any personal information. Compliance is a big deal these days, and neither buyers nor sellers want to mess with private data.
Returns rates — a common blind spot in online retail
Whenever we use alternative data to model some KPI we have some known ‘blind spots’. For example, while US credit card data can track revenue within the United States, it fails to capture financial activity in other regions. Similarly, scraped inventory data can sometimes be used for monitoring online purchases but not offline transactions. When modelling net revenues in online retail, returns rates become a very common blind spot. This isn't usually an issue if the rate remains consistent from one quarter to the next. However this is not always the case, for example when returns rates were very volatile during the lockdown in 2020-2022 or when online retailers started introducing return fees.
This motivated me to explore whether email receipt data could help track returns rates effectively. I shared my findings in a 2022 Medium post using ASOS—a UK-based online fashion retailer—as a case study. Since then, ASOS has lost much of its market value, making it less relevant to investors today. Nonetheless, the methodologies I discussed are applicable to other retailers, provided the sample size is sufficient and we can accurately identify and correlate purchases and returns.
The first thing to keep in mind is that businesses often do not explicitly report return rates. In some instances, we can estimate this figure by comparing net and gross sales, assuming both metrics are disclosed. For example, ASOS, which stopped reporting gross revenue and gross average order value in 2021, no longer allows for a straightforward calculation of return rates. Without a reliable 'ground truth' KPI to benchmark our forecasts against, it's challenging to gauge the accuracy of our predictions. However, occasional insights from quarterly investor presentations can offer a glimpse into the expected pattern:
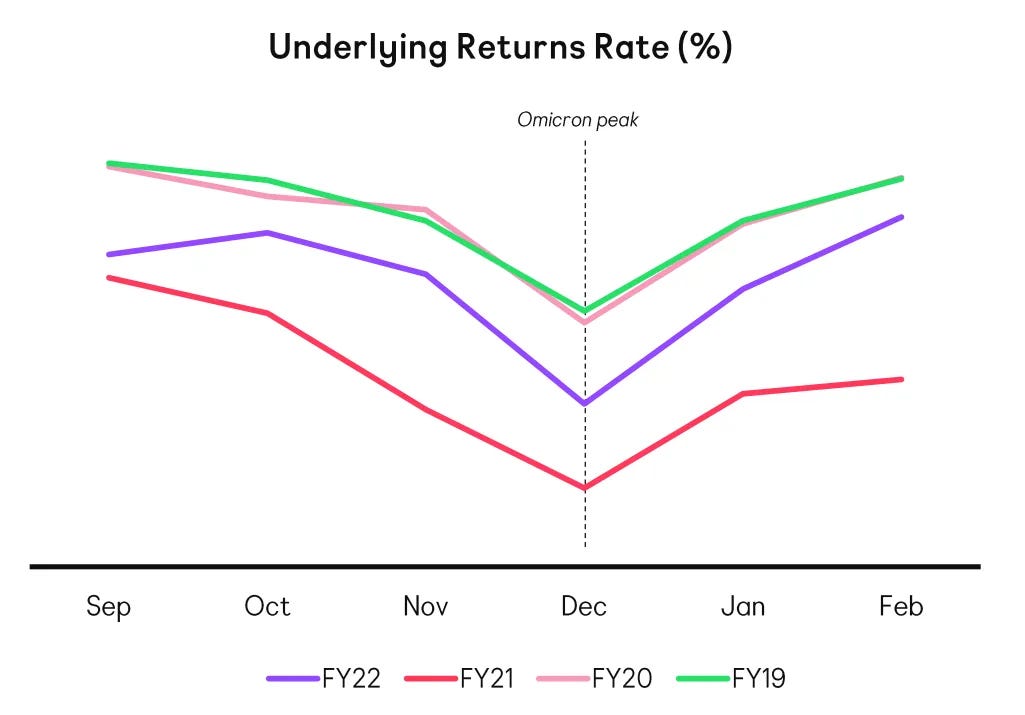
One issue with tracking returns rates is that they are inherently lagging indicators. Products purchased during high-sales periods like November's Black Friday are often not returned until late December. Calculating the ratio of purchases to returns within the same month could misleadingly depict a low return rate in November and an anomalously high rate in December. However, this doesn't accurately reflect the underlying returns rate—defined as the percentage of orders made within a specific period that are eventually returned.
To overcome this, we can match original purchases with their subsequent returns and this is where email receipt data (or possibly credit card transaction data) comes into play. If we can align purchases with returns we can get a true picture of returns rates across different periods.
This dynamic also introduces a particular challenge when we look at “live” most recent data. For instance, if we examine purchases made just two weeks ago, we'll only have visibility into the returns that occurred within the first week—a fraction that we know represents only a small percentage of the total returns. To get earlier insights into the returns rate, we can group our data based on the timing of returns relative to their original purchase dates. That way we can have historical comparables and make an early assessment of the trend.
When I did the analysis on ASOS e-receipt data, this is what the results looked like:
Looking at the chart, while the small sample size introduces some noise, the observed seasonal pattern aligns with what was highlighted in the investor presentation slide: notably, returns tend to decrease every December. This seasonal trend likely extends beyond just ASOS. When modelling Net Revenues of online fashion retailers with, say, credit card data, we may encounter residual seasonality that can be attributed to this recurring pattern.
One limitation of my analysis is that it treats each order as either fully returned or not returned at all, which doesn't account for the possibility that customers might return only part of their purchase.
The >40% returns rate might seem unrealistic. However, a review of historical earnings reports from ASOS, when they still disclosed both net and gross sales, validates this figure. For instance, for the period ending on 29 February 2020, ASOS reported average order value of £73.44 per 41.1 million orders, totaling £3,018 million, while the Net Revenue was reported as £1,596.8 million. This data indicates a returns and cancellations rate of 47%—a mind-boggling number!
For those interested in the technical details of my implementation, I've included some of the code below. The transformation is applied to a dataset with raw email receipts, containing both the purchase and return receipts in the same table. I use order numbers to match returns with the original purchases.
with purchase_receipts as
  (
    select
      min(email_time) as email_time,
      order_number
    from
      ereceipts
    where
      contains(lower(email_subject),'thanks for your order')
    group by
      order_number
  ),

return_receipts as
  (
    select
      min(email_time) as email_time,
      order_number
    from
      ereceipts
    where
      contains(lower(email_subject),'return') or contains(lower(email_subject),'refund')
    group by
      order_number
  ),

purchases_and_returns as
  (
    select
      purchase_receipts.order_number,
      purchase_receipts.email_time as purchase_time,
      return_receipts.email_time as return_time,
      coalesce (
        datediff('week', purchase_time, return_time),
        -1
      ) as returned_after_x_weeks
    from
      purchase_receipts
    left join
      return_receipts
    on
      purchase_receipts.order_number = return_receipts.order_number
    where
      returned_after_x_weeks < 6 -- we exclude anything that has been returned after more than 5 weeks as this doesn't meet standard return policy.
  ),

weekly_purchases as (
    select
        date_trunc('week', purchase_time) as purchase_week,
        count(*) as total_purchases
    from
        purchases_and_returns
    group by
        date_trunc('week', purchase_time)
),

weekly_returns as (
    select
        date_trunc('week', purchase_time) as purchase_week,
        returned_after_x_weeks,
        count(*) as number_returned
    from
        purchases_and_returns
    where
        returned_after_x_weeks >= 0
    group by
        date_trunc('week', purchase_time),
        returned_after_x_weeks
),

return_percentages as (
    select
        wp.purchase_week,
        wr.returned_after_x_weeks,
        wr.number_returned,
        wp.total_purchases,
        (wr.number_returned * 100.0 / wp.total_purchases) as return_percentage
    from weekly_purchases wp
    join weekly_returns wr on wp.purchase_week = wr.purchase_week
)

select * from return_percentages
order by purchase_week, returned_after_x_weeks
I hope this deep dive into the use of email receipt data to track returns rates offers both a practical tool and a new perspective on the power of alternative data. As this newsletter is still a relatively new project for me, I am very open to any feedback you might have. Whether it's topics you find particularly interesting, areas you think we could explore further, or any other comments that could help shape future editions — please reach out and let me know!
Very nice insight from the "out-of-the-webscraping-world" ecosystem, thanks for sharing!